Why the Comparison Flow Infographic Is Changing How Teams Communicate Complex Decisions
When you’re weighing options—whether it’s choosing a project management tool, comparing cloud hosting providers, or mapping out customer journey touchpoints—the real challenge isn’t gathering data. It’s presenting it in a way that invites clarity, not confusion. That’s where the Comparison Flow Infographic steps in—not as a decorative flourish, but as a functional communication engine.
More Than Just Side-by-Side Boxes
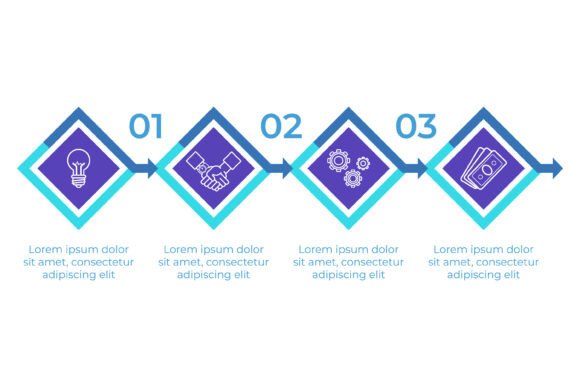
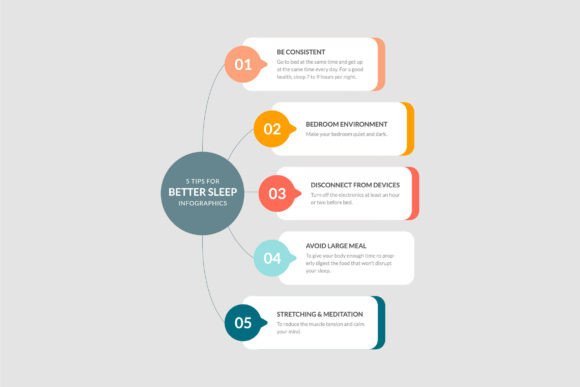
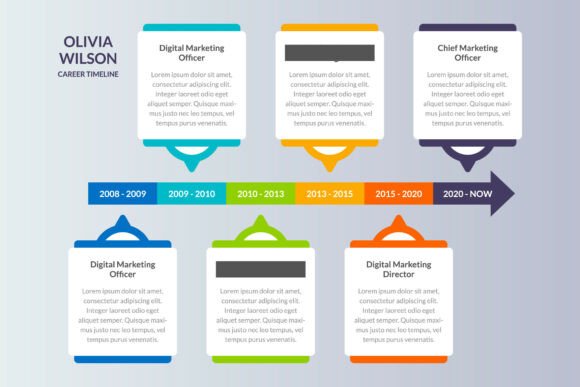
At first glance, a Comparison Flow Infographic looks familiar: horizontal blocks, clean separation, icons anchoring each idea. But what sets it apart is its intentional flow—not static comparison, but guided progression. Unlike traditional tables or bullet lists, this layout uses directional arrows to imply sequence, priority, or cause-and-effect. A block doesn’t just sit next to another; it leads to it.
Think of onboarding a new SaaS product. Instead of dumping feature comparisons into a spreadsheet, a team might use a Comparison Flow Infographic to show how “Basic Plan” unlocks core functionality, how “Pro Plan” adds automation triggers, and how “Enterprise” enables custom integrations—each step visually connected, each icon reinforcing purpose (e.g., a gear for settings, a chain link for integrations, a shield for security).
The Anatomy of Clarity
Four structural choices make the Comparison Flow Infographic uniquely effective:
- Modular layout: Each section stands alone yet belongs to a unified system. This supports scanning—readers can drop in at any point without losing context.
- Icon-supported sections: Icons aren’t decorative extras. They serve as visual shorthand—reducing cognitive load and reinforcing meaning before the eye reaches the text. A lightbulb signals “insight,” a graph signals “metrics,” a handshake signals “collaboration.”
- Clean alignment: Horizontal rhythm creates predictability. Consistent spacing, uniform font sizing, and balanced padding tell the brain, “This is organized—and therefore trustworthy.”
- Directional arrows: These are the quiet conductors. They don’t shout “next!”—they suggest relationship. Arrows can indicate escalation (e.g., from awareness → consideration → decision), dependency (e.g., “API access” requires “SSO enabled”), or contrast (e.g., “Manual review” vs. “AI-powered triage”).
Used well, these elements turn abstract trade-offs into navigable pathways. That’s why marketing teams use them to map buyer personas across funnel stages, HR departments deploy them to compare remote-work policies by region, and educators build them to contrast learning models—project-based vs. flipped vs. competency-based—with clear visual anchors.
Where It Fits in Real Workflows
The Comparison Flow Infographic thrives where decisions involve nuance, stakeholders vary in expertise, and time is scarce. Consider a healthcare IT rollout: clinicians need quick clarity on workflow impact; administrators care about compliance and cost; executives want ROI timelines. A single, horizontally arranged infographic—using icons for “patient intake,” “EHR sync,” “audit trail,” and arrows showing handoffs and approvals—serves all three audiences simultaneously.
It’s also gaining traction in agile environments. Product owners use it during sprint planning to compare backlog items by effort, user value, and technical risk—each dimension a labeled block, arrows indicating dependencies or sequencing logic. Developers don’t need to parse Jira comments or dig through Confluence docs. The flow is visible, shared, and editable in real time.
Practical Benefits You Can Measure
Teams adopting the Comparison Flow Infographic report measurable shifts—not just in aesthetics, but in outcomes:
- Faster alignment: Cross-functional workshops cut decision latency by up to 40%, according to internal reports from design-led tech firms. When options are spatially related and visually anchored, debate centers on substance—not interpretation.
- Fewer revision cycles: Stakeholders grasp intent faster. One fintech startup reduced stakeholder feedback rounds on pricing strategy decks from five to two after switching from dense slides to a modular Comparison Flow Infographic.
- Stronger retention: Visual-spatial memory kicks in. In usability tests, participants recalled 68% more differentiators when information was delivered via a flow-based infographic versus a standard comparison table.
That last point matters deeply in sales enablement, training, and change management—contexts where understanding must stick, not just land.
What to Watch For (and What to Skip)
Not every comparison needs this treatment. Over-engineering a simple yes/no choice with arrows and icons adds friction, not insight. Ask yourself: Is there sequence? Dependency? Escalation? If the answer is no, a clean checklist or table may be wiser.
Also avoid common pitfalls:
- Overloading blocks: Each section should hold one core idea—plus brief supporting detail. More than two sentences per block dilutes scannability.
- Inconsistent icon logic: Don’t mix metaphors. If you use a rocket for “speed,” don’t switch to a stopwatch for “efficiency.” Keep icon semantics tight and repeatable.
- Ignoring responsive behavior: On mobile, horizontal flow must adapt—either stack cleanly or offer subtle scroll cues. A broken layout undermines credibility faster than missing data.
And remember: the Comparison Flow Infographic works best when paired with concise narrative. Use a short intro paragraph to frame the “why” behind the comparison, then let the visual do the heavy lifting. No need to restate every label—trust the design.
Getting Started—Without the Overhead
You don’t need a designer or expensive software to begin. Start with pen and paper—or a blank slide grid. Sketch three to five key comparison points. Assign each an icon (even if rough). Draw arrows between them—not arbitrarily, but based on how they relate in practice. Then test it: Show it to someone unfamiliar with the topic. Can they explain the relationships back to you in under 30 seconds?
Tools like Figma, Miro, and even PowerPoint support modular, icon-driven layouts with ease. Look for templates labeled “comparison flow,” “decision pathway,” or “feature matrix”—but customize relentlessly. Default colors, fonts, or arrow styles often mute meaning. Your version should reflect your brand voice and your audience’s expectations.
One agency client switched from generic stock-infographic templates to internally built Comparison Flow Infographic kits—complete with approved icons, accessible color palettes, and reusable arrow styles. Their proposal win rate increased 22% in six months. Not because the visuals were prettier—but because clients finally saw how pieces fit together.
Final Thought: It’s About Shared Understanding
The Comparison Flow Infographic succeeds not because it’s novel, but because it answers a persistent human need: to see connections clearly, quickly, and confidently. In a world of fragmented tools, overlapping responsibilities, and shrinking attention spans, clarity isn’t a luxury—it’s infrastructure. When your team can look at a single, well-structured horizontal flow and say, “Yes—that’s how it works,” you’ve done more than communicate. You’ve aligned.