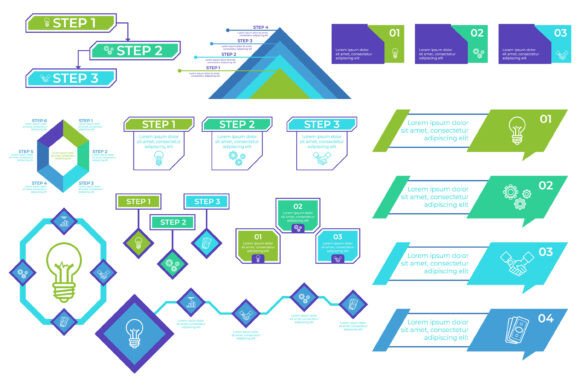
Step-by-Step Infographic Set: Clarity Through Structured Visual Flow
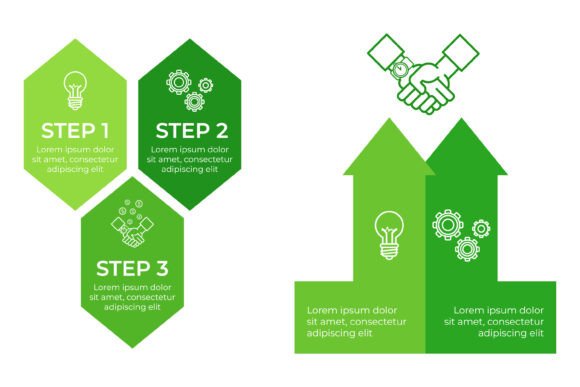
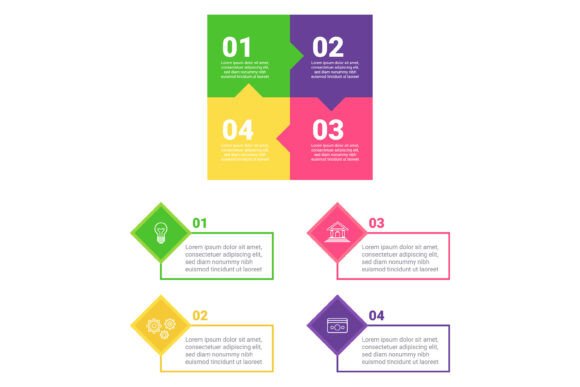
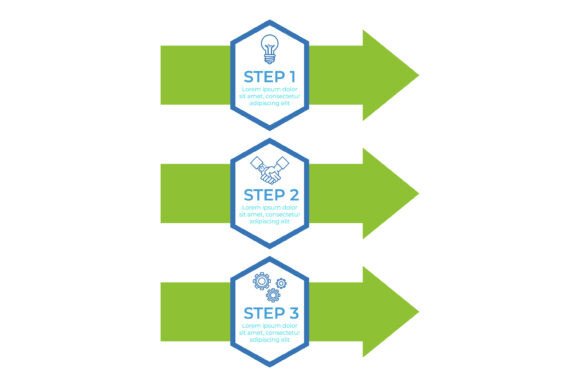
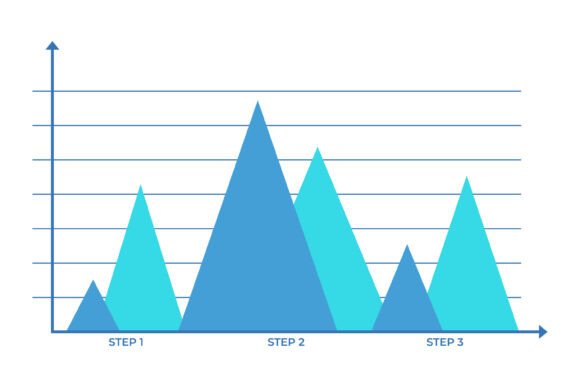
A Step-by-step Infographic Set is a curated collection of modular, visually cohesive graphics designed to represent sequential processes—like onboarding workflows, project lifecycles, product development stages, or customer journey phases. Unlike generic icons or isolated illustrations, each visual in the set follows a deliberate design logic: consistent spacing, intentional shape language (e.g., circles for start points, arrows for transitions, rectangles for actions), and a harmonized color palette that supports both hierarchy and accessibility. What makes it distinct isn’t just aesthetics—it’s the underlying system that ensures every step feels equally weighted, logically connected, and instantly scannable.
How It Differs From Other Visual Approaches
Many professionals reach for flowcharts, timeline templates, or custom-built slides when explaining progression—but those often lack consistency across uses. A flowchart drawn in PowerPoint may use inconsistent line weights or arbitrary colors; a timeline from a free template site might prioritize decoration over clarity. In contrast, a Step-by-step Infographic Set is built around repetition with purpose: each step shares proportional sizing, uniform stroke widths, and thoughtful negative space. This creates rhythm—not just in one slide, but across an entire deck or report.
Compared to illustration-based infographics (which tell stories through scenes or metaphors), this type prioritizes structure over narrative. It doesn’t try to depict “a team brainstorming” or “data flowing through servers.” Instead, it focuses on order, sequence, and interdependence. That makes it especially effective for technical audiences, cross-functional teams, or stakeholders who need to align on process logic—not just appreciate visual flair.
Where It Fits Among Alternatives
There are several common alternatives when communicating process information:
- Text-based outlines: Clear and accessible, but lack spatial relationships. Readers must mentally reconstruct order and dependencies.
- Linear timelines: Strong for time-bound sequences (e.g., “Q1–Q4 roadmap”), but weak for iterative or branching flows (e.g., feedback loops or conditional approvals).
- Swimlane diagrams: Excellent for showing handoffs between roles or departments, but can become dense and difficult to scale beyond 4–5 steps without losing readability.
- Custom-coded animations or interactive dashboards: Powerful for engagement and real-time data, yet require development time, maintenance, and often sacrifice portability across platforms.
A Step-by-step Infographic Set sits between simplicity and sophistication. It doesn’t demand coding skills or specialized software knowledge, yet delivers more precision than bullet points. It’s portable—works as static images in PDF reports, editable vector files in presentations, or embedded assets in internal wikis. And because it’s pre-designed with flexibility in mind (e.g., interchangeable labels, scalable shapes), it avoids the rigidity of one-size-fits-all templates.
Strengths and Practical Tradeoffs
The primary strength lies in its balance of speed and fidelity. You can assemble a polished 6-step workflow in under five minutes—not by dragging random shapes, but by selecting from a library where alignment, spacing, and contrast are already resolved. Colors are chosen for both vibrancy and legibility (e.g., sufficient contrast against white or dark backgrounds), and shapes carry meaning: diamonds signal decisions, rounded rectangles denote actions, and soft arcs suggest transitions.
That said, there are tradeoffs. Because the set emphasizes consistency, it’s less suited for highly contextual or emotionally charged topics—say, illustrating grief stages or cultural adaptation journeys—where symbolic nuance matters more than structural rigor. Similarly, if your process involves frequent branching, parallel tracks, or nested substeps, you’ll likely need to supplement the base set with additional elements or annotations rather than rely on it exclusively.
Another consideration is customization depth. While most Step-by-step Infographic Sets include editable text and recolorable vectors, they’re not infinitely malleable. If you need to integrate live data feeds, dynamic numbering, or responsive resizing across devices, you’ll still need complementary tools like Figma plugins or presentation add-ons.
When It’s the Right Choice—and When It Isn’t
A Step-by-step Infographic Set shines in situations where clarity, repeatability, and cross-platform compatibility matter more than bespoke artistry. For example:
- A marketing manager building quarterly campaign decks for leadership review—needs visuals that look professional whether exported to PDF, shown on Zoom, or printed for board meetings.
- An HR specialist documenting a new remote onboarding sequence—requires visuals that remain legible at small sizes (e.g., in a digital handbook) while clearly distinguishing “submit documents,” “complete training,” and “meet manager.”
- A product team aligning engineering, design, and support around a release checklist—benefits from visuals where each phase has equal visual weight and no single step dominates attention unnecessarily.
Conversely, it’s less ideal when:
- Your audience expects deep interactivity (e.g., clicking a step to reveal metrics or comments).
- You’re mapping complex systems with overlapping responsibilities—like IT security incident response, which often involves concurrent detection, containment, communication, and forensics.
- You’re working under strict brand guidelines that prohibit any deviation from exact hex codes, font pairings, or icon styles—some sets offer limited variants, so verify flexibility before committing.
Realistic Integration Examples
Consider a university department updating its grant application process. Instead of listing “1. Draft proposal → 2. Internal review → 3. Budget approval → 4. Submission,” they use a Step-by-step Infographic Set where each stage appears as a distinct, color-coded module. Arrows between them are subtle but directional; hover states (in digital versions) reveal average turnaround times or responsible offices. The result isn’t just prettier—it reduces follow-up questions from applicants by 30% in early testing, because expectations about timing and ownership are embedded visually, not buried in footnotes.
Or take a SaaS company simplifying its API integration documentation. Developers scanning quickly need to grasp the required sequence: authenticate → request token → call endpoint → parse response → handle errors. A linear, shape-based infographic makes that flow obvious at a glance—far more than a wall of curl commands ever could. Importantly, the same visual works in their public docs, internal training slides, and customer-facing onboarding emails, maintaining message consistency without redesign effort.
Making an Informed Decision
Before choosing a Step-by-step Infographic Set—or any visual resource—ask yourself three things:
- What’s the primary goal? Is it alignment? Education? Persuasion? If the answer is alignment or education, structured visuals tend to outperform decorative ones.
- Who’s interpreting it—and where? If it will appear in low-bandwidth environments (e.g., shared via email to global teams), lean toward lightweight, vector-based formats rather than high-res raster images or embedded web components.
- How much time do you have to adapt it? Some sets ship with PowerPoint, Keynote, and Google Slides versions; others are Illustrator-only. Match format availability to your team’s everyday tools—not just your ideal ones.
Also consider scalability. Will you need variations—for example, a condensed 3-step version for social media summaries, or an expanded 12-step version for implementation playbooks? Check whether the set includes modular components (individual steps, connectors, annotations) or only fixed layouts. Modularity gives you room to grow without buying new assets later.
Ultimately, a Step-by-step Infographic Set isn’t about replacing thought—it’s about giving structure to it. It helps translate abstract sequences into shared understanding, especially when time, attention, and consistency are limited. Used deliberately, it supports better decisions, fewer miscommunications, and smoother handoffs—not because it’s flashy, but because it respects how people actually process information: step by step.