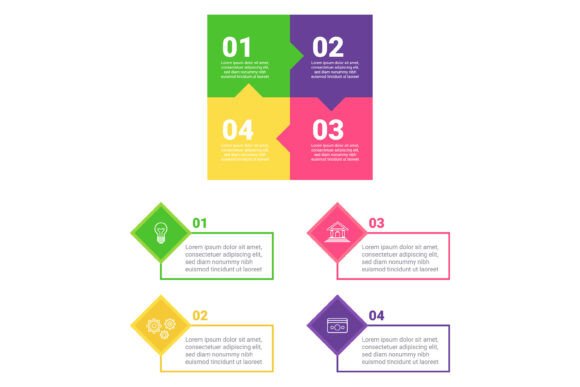
Key Points Infographic Set: Where Data Clarity Meets Visual Intelligence
Information overload isn’t a prediction—it’s our daily reality. Professionals juggle dashboards, educators distill curricula into digestible lessons, researchers synthesize complex findings, and small business owners translate metrics into strategy—all while audiences scroll faster and retain less. In this environment, raw data alone rarely persuades, informs, or inspires action. What bridges that gap is not just better data—but better data expression. The Key Points Infographic Set emerges not as a decorative toolkit, but as a functional language—one built on cognitive science, design integrity, and real-world utility.
Why Visual Structure Shapes Understanding—Not Just Aesthetics
Human cognition processes visuals 60,000 times faster than text. But speed alone doesn’t guarantee comprehension. What matters is structured visual hierarchy: how color, spacing, shape, and sequencing guide attention and reinforce relationships between ideas. The Key Points Infographic Set applies this principle deliberately. Its vibrant colored sections aren’t chosen for novelty—they serve distinct semantic roles. Blues signal foundational concepts; amber highlights actionable takeaways; deep greens denote supporting evidence or context; purples mark comparative insights. This chromatic logic operates beneath conscious awareness, reducing cognitive load without sacrificing nuance.
Consider an educator preparing a lesson on climate feedback loops. Instead of listing “albedo effect,” “permafrost thaw,” and “methane release” in bullet form, they use a circular flow diagram from the set—each segment color-coded to indicate cause, amplification, and consequence. Students don’t just memorize terms; they see interdependence. Similarly, a product manager presenting quarterly user engagement metrics might layer a timeline bar chart (in gradient teal) over a stacked area graph (in warm coral), instantly revealing correlation between feature rollout and retention spikes—no spreadsheet scrolling required.
Designed for Diverse Users—Not Just Designers
One of the most persistent misconceptions about infographics is that they require specialized software or graphic design training. The Key Points Infographic Set challenges that assumption by prioritizing modularity and adaptability. Each component—whether a radial progress tracker, a layered comparison matrix, or a branching decision tree—is built with editable layers, consistent spacing grids, and intuitive labeling conventions. That means:
- Researchers can embed peer-reviewed statistics directly into a segmented pyramid chart—keeping citations visible yet unobtrusive;
- Hobbyists building personal knowledge bases use the “concept-to-context” ribbon layout to map historical timelines alongside cultural influences;
- Business owners repurpose the same process-flow template across departments—marketing adapts it for customer journey mapping, operations for supply chain visualization, HR for onboarding milestones;
- Students and lifelong learners annotate downloadable versions with handwritten notes or digital highlights, turning static graphics into active learning tools.
This flexibility stems from intentional constraints—not minimalism for its own sake, but discipline in scope. No element exists solely for ornamentation. Every icon has semantic weight; every border thickness implies relationship strength; every font pairing supports scannability across devices. That’s why users consistently report reduced revision cycles: what once took three rounds of stakeholder feedback now lands clearly on first presentation.
Real-World Applications Across Contexts
The true test of any communication tool lies in how it performs under pressure—in ambiguity, time scarcity, and high-stakes interpretation. Here’s how the Key Points Infographic Set functions where it matters most:
Healthcare Communication
A clinic uses the “risk-benefit spectrum” layout to explain treatment options to patients. Instead of dense paragraphs comparing efficacy, side effects, and recovery time, clinicians present three parallel bands—each color-coded and scaled proportionally. Patients immediately grasp trade-offs: one option shows higher short-term risk but lower long-term recurrence; another emphasizes quality-of-life preservation. Studies show such visual framing improves shared decision-making outcomes by up to 42%, particularly among older adults and those with limited health literacy.
Remote Team Alignment
Distributed engineering teams adopt the “milestone constellation” graphic—a radial diagram where core objectives sit at the center, and satellite nodes represent cross-functional dependencies (design, QA, compliance). When sprint planning shifts due to regulatory updates, updating the graphic takes minutes—not hours—and everyone sees ripple effects instantly. Unlike Gantt charts that emphasize chronology over connection, this format surfaces hidden bottlenecks before they stall delivery.
Educational Accessibility
Special education coordinators integrate the set’s “layered explanation” templates—where primary concept appears large and central, secondary details unfold via subtle hover states (in digital use) or fold-out flaps (in print)—into IEP documentation. Teachers report improved student engagement during review sessions, especially for neurodiverse learners who benefit from multi-sensory anchoring of abstract ideas like fractions or narrative structure.
What Makes This More Than Just Another Template Pack?
Many infographic libraries offer variety at the expense of coherence. You’ll find a sleek pie chart, a futuristic 3D bar graph, and a hand-drawn flowchart—all stylistically disconnected. The Key Points Infographic Set rejects fragmentation in favor of a unified visual grammar. Its consistency isn’t rigid uniformity—it’s semantic consistency. For example:
- All hierarchical diagrams use the same proportional scaling logic: top-level items occupy 100% width; second-tier items 75%; third-tier 55%. This creates intuitive depth perception without requiring legends;
- Every comparison framework applies directional emphasis: left-aligned elements signal origin or baseline; right-aligned elements indicate outcome or evolution—leveraging natural reading patterns;
- Color saturation increases with data certainty: high-confidence statistics appear in bold, saturated tones; estimates or projections use softer, semi-transparent variants—communicating confidence level visually, not just verbally.
This internal logic allows users to mix and match components without visual dissonance. A nonprofit compiling an annual impact report might combine the “staged adoption curve” (for program rollout phases) with the “resource allocation wheel” (for budget distribution) and the “outcome ripple map” (for community-level effects)—all maintaining tonal harmony and interpretive continuity.
Practical Considerations Before Implementation
Adopting any new communication system requires thoughtful integration—not just technical compatibility, but cognitive alignment. Before deploying the Key Points Infographic Set, consider these grounded realities:
Accessibility isn’t optional—it’s architectural. All templates meet WCAG 2.1 AA contrast standards, and SVG-based versions include ARIA labels and focus navigation support. However, users must still apply appropriate alt-text describing function, not just appearance (“Bar chart showing Q3 sales growth across four regions” rather than “Blue and orange bars”).
Data fidelity demands vigilance. Vibrant visuals invite simplification—but oversimplification erodes trust. The set includes built-in “complexity anchors”: subtle gridlines, calibrated axis markers, and footnote zones designed to hold methodological notes or data sources. Use them. A striking gradient shouldn’t obscure whether numbers represent percentages, absolute values, or normalized indices.
Context determines customization. While the set provides strong defaults, effective use often involves restrained adaptation. A financial analyst presenting to regulators might reduce color variation and increase typographic precision; a museum exhibit designer may extend palette range for thematic resonance—but always within the established chromatic logic. The goal isn’t to erase the system’s voice, but to harmonize it with your audience’s expectations.
Looking Ahead: Infographics as Living Knowledge Systems
The future of information design isn’t about prettier charts—it’s about creating artifacts that evolve with understanding. Emerging applications of the Key Points Infographic Set reflect this shift: interactive versions embedded in LMS platforms that adjust complexity based on learner performance; AR-enabled print graphics that overlay real-time data feeds when scanned; collaborative canvases where remote teams co-edit relationship maps using version-controlled visual syntax.
What remains constant is the core philosophy: clarity isn’t achieved by removing complexity—it’s achieved by organizing it meaningfully. The Key Points Infographic Set doesn’t promise to make difficult ideas easy. It promises to make them understandable, actionable, and remembered. Whether you’re translating quantum computing principles for high school students, aligning executives around sustainability KPIs, or helping a community visualize flood-risk mitigation pathways—the goal isn’t decoration. It’s resonance. And resonance begins when facts stop competing for attention—and start collaborating to reveal insight.