Why a Process Infographic Transforms How Teams Understand and Execute Complex Work
Have you ever sat through a 45-minute project kickoff—only to walk away unsure of your next step? Or watched a colleague nod along during a strategy session, then later admit they weren’t clear on how their piece fit into the bigger picture? These moments aren’t failures of effort—they’re symptoms of information overload, unclear sequencing, and disconnected communication. That’s where a well-crafted Process Infographic steps in—not as decoration, but as a functional bridge between intention and action.
More Than Just Pretty Pictures: What Makes a Process Infographic Effective?
A Process Infographic isn’t simply a timeline with arrows. It’s a deliberate visual translation of logic, sequence, and interdependence. At its best, it distills a multi-layered procedure—like launching a new product, onboarding remote staff, or optimizing customer support workflows—into something instantly scannable, memorable, and actionable.
What separates a good one from a forgettable one? Three non-negotiable qualities:
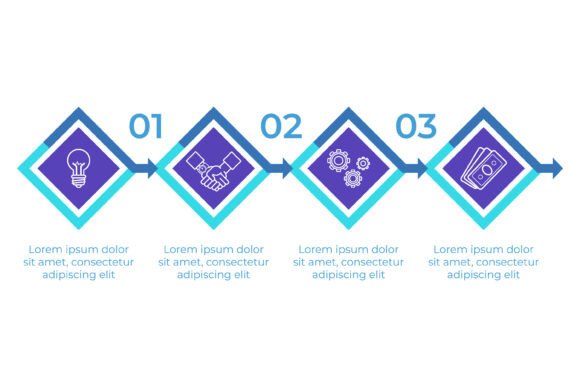
- Clarity over cleverness: No hidden metaphors or abstract shapes that require decoding. Icons are intuitive (a lightbulb for idea generation, two overlapping figures for collaboration, a gear turning for implementation), not cryptic.
- Progressive flow: The eye moves naturally—from left to right or top to bottom—mirroring how humans process cause-and-effect relationships. Each stage builds logically on the last, with visual cues like numbered circles, connecting lines, or subtle color gradients reinforcing sequence.
- Strategic emphasis: Not every step carries equal weight. A strong Process Infographic highlights pivotal moments—like stakeholder alignment or prototype testing—with bolder typography, contrasting color, or spatial prominence.
Think of it like a subway map: you don’t need to know the engineering specs of every tunnel to navigate the system. You just need to see which stops come next—and how to transfer. That’s the power of intentional design.
Idea Generation, Collaboration, Implementation: The Core Triad Visualized
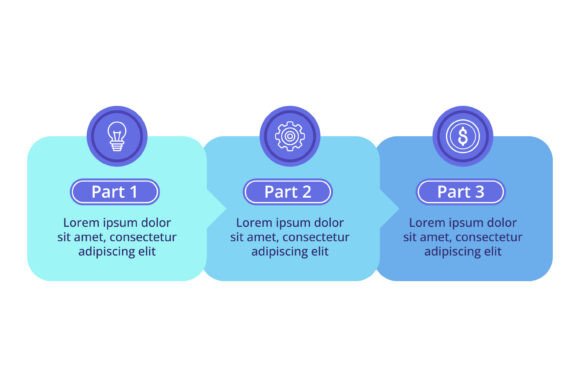
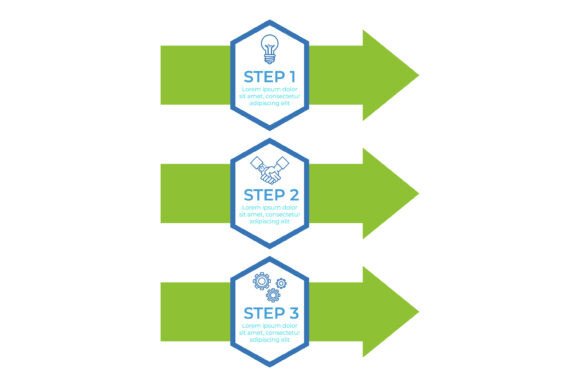
Many modern processes hinge on three interconnected phases—each requiring different mindsets, tools, and team dynamics. A thoughtful Process Infographic doesn’t treat them as siloed boxes. Instead, it shows how they feed into one another.
Idea Generation: Where Curiosity Gets Structure
This phase is often mislabeled as “brainstorming”—but real ideation is more disciplined than free association. In an effective Process Infographic, this stage includes prompts like “Ask ‘what if’ questions,” “Map pain points from user interviews,” or “Scan adjacent industries for inspiration.” Icons here might include a notebook, a question mark inside a circle, or diverging arrows—signaling exploration, not finality.
Without visual framing, teams rush past this step—or worse, skip it entirely—jumping straight to solutions before fully understanding the problem. A Process Infographic slows that impulse down by giving idea generation visible weight and space.
Collaboration: Turning Individual Input Into Shared Ownership
Here’s where many infographics falter: they show people standing together, smiling—but that’s symbolism, not substance. A high-performing Process Infographic illustrates *how* collaboration happens: “Share drafts in real time using version-controlled docs,” “Host 30-minute cross-functional feedback loops,” or “Assign clear decision rights per milestone.”
The icons shift too—overlapping speech bubbles, shared dashboards, synchronized calendars. This isn’t about harmony; it’s about structured interaction. When teams reference this part of the graphic during stand-ups or retrospectives, they’re not just seeing “collaborate”—they’re seeing *how*.
Solution Implementation: From Plan to Pulse
Implementation is where intentions meet reality. A weak infographic ends here with a checkmark. A strong one shows iteration: “Deploy minimum viable version,” “Collect usage metrics for 72 hours,” “Adjust based on frontline feedback.” It acknowledges that execution isn’t linear—it’s responsive.
This stage often uses grounding visuals: footprints, upward graphs with small dips, or gears meshing. It signals motion, adaptation, and accountability—not just completion.
Where This Graphic Fits in Real-World Workflows
You’ll find the Process Infographic thriving in contexts where clarity accelerates adoption:
- In onboarding decks: New hires absorb complex internal workflows faster when shown visually—not buried in policy PDFs.
- During client workshops: Instead of talking *about* discovery or delivery phases, facilitators point to the graphic and ask, “Where do you see your biggest bottleneck?”
- In agile retrospectives: Teams use printed versions to annotate what worked, what stalled, and where handoffs broke down—making improvement tangible.
- In grant proposals or stakeholder reports: Funders and executives scan quickly. A clean Process Infographic proves methodological rigor without demanding a deep read.
It’s also proving essential in hybrid and asynchronous environments. When team members aren’t sharing physical whiteboards, a shared digital Process Infographic becomes a living reference—embedded in Notion, linked in Slack, pinned in Zoom backgrounds.
Choosing or Creating Your Own: Practical Considerations
If you’re evaluating an existing Process Infographic—or planning to build one—ask these questions:
- Does it reflect your actual workflow—or an idealized version? If your “collaboration” step really involves three rounds of email approvals and a final sign-off in DocuSign, the graphic should show that—not just two people shaking hands.
- Is terminology consistent with how your team speaks? Avoid jargon like “synergize” or “leverage.” Use words your engineers, designers, and customer success reps all recognize.
- Can it scale across formats? Does it remain legible at thumbnail size (for slide decks) and readable when printed on A3 paper (for workshop walls)? Test contrast, font sizing, and icon simplicity early.
- Who owns updates? A static graphic grows outdated fast. Assign someone—not just to design it, but to revise it quarterly or after major process shifts.
And if you’re building one internally: start simple. Sketch the sequence on paper first. Identify the 3–5 non-negotiable steps—the ones that, if skipped, derail everything else. Then layer in supporting actions, decisions, and feedback loops. Resist the urge to add “everything.” Precision beats comprehensiveness every time.
Final Thought: Clarity Is a Competitive Advantage
In a world saturated with information, attention is scarce—and confusion is costly. Every meeting extended due to misalignment, every sprint derailed by unclear handoffs, every training session repeated because materials weren’t absorbed—that’s operational drag. A Process Infographic doesn’t eliminate complexity. But it does remove unnecessary friction from navigating it.
When done right, it becomes more than a deliverable. It becomes common language. A shared mental model. A quiet, steady guidepost—helping teams move forward, together, without constantly reorienting.
So the next time you’re mapping a new initiative, revising a SOP, or preparing a cross-departmental briefing—don’t default to bullet points or dense paragraphs. Reach for the Process Infographic. Not as flair. But as function.