Vertical Rectangle Infographic Template
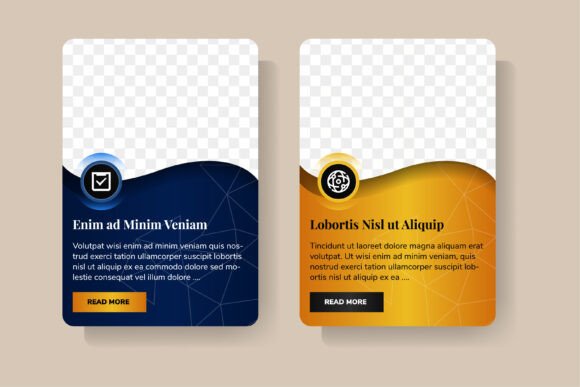
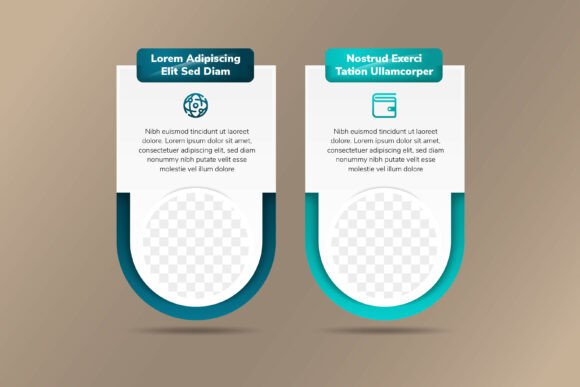
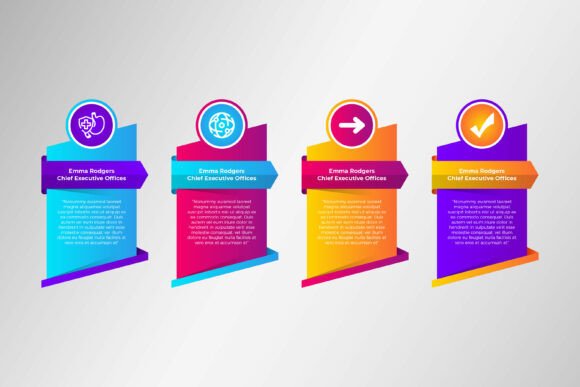
A well-designed vertical rectangle infographic isn’t just another layout—it’s a focused visual tool built for clarity, flow, and impact. This particular template uses a diagonal rectangle as its foundational background element, guiding the eye naturally from top to bottom while reinforcing directionality and progression. Paired with clean arrows, balanced circles, modular text blocks, and distinct visual elements, it transforms abstract ideas—like timelines, processes, or hierarchical data—into intuitive, scannable stories.
What makes this design especially useful is how the diagonal background subtly implies motion without overwhelming content. Unlike static grids or rigid columns, it adds energy and purpose—ideal when you’re illustrating growth, transformation, or sequential steps. The included gradient-colored arrows aren’t decorative; they serve as visual anchors that highlight transitions between stages, making complex flows feel digestible at a glance.
Why structure matters—and how this template supports it
Clarity in communication often hinges on structure—not just what you say, but how information is ordered and connected. A vertical rectangle infographic works exceptionally well for linear narratives: onboarding sequences for new team members, product feature walkthroughs, step-by-step tutorials, or even academic research summaries. Because the layout is inherently directional, viewers follow the path organically—no guessing where to look next.
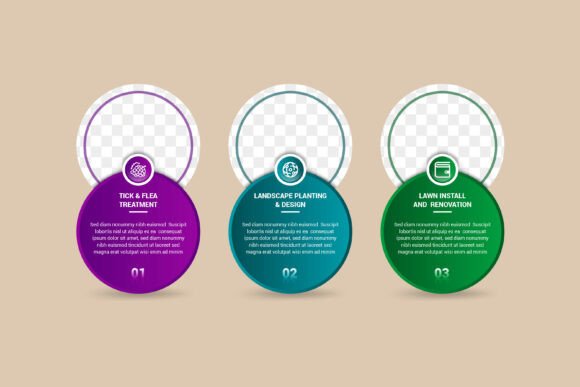
The circle elements function as focal points—perfect for highlighting key metrics, milestones, or decision nodes. You might use one to mark “User Sign-Up Complete,” another for “Payment Processed,” and a third for “Welcome Email Sent.” Their consistent shape creates rhythm, while their placement along the arrow path reinforces causality. Text remains legible and purposeful, never cramped or secondary, because spacing and hierarchy are baked into the original design.
Real-world applications across roles
Marketers building campaign reports benefit from the ability to layer KPIs alongside narrative context—each circle can represent a channel (e.g., email, social, paid search), with gradient arrows showing traffic flow or conversion lift. Educators preparing lesson summaries find the vertical format ideal for scrolling digital handouts or LMS modules, where students consume content on mobile or tablet screens.
Freelancers pitching services use this template to outline their workflow: discovery → strategy → design → delivery. The diagonal background suggests forward momentum, aligning visually with client expectations of progress and results. Small business owners mapping customer journeys appreciate how easily they can swap out placeholder text and icons to reflect real touchpoints—from first ad click to post-purchase review.
Even technical writers documenting API integrations or software updates rely on clear sequencing. Here, the vector-based arrows and editable shapes mean you can adjust line weight, curvature, or color intensity to match brand guidelines—without losing precision or resolution.
Practical advantages of the file package
This Vertical Rectangle Infographic comes fully layered and organized in industry-standard formats: AI and EPS for deep editing in Adobe Illustrator, SVG for responsive web use, and high-resolution JPG for quick sharing or print-ready presentations. All graphics are 100% vector—so whether you scale it to fit a large conference banner or shrink it for an email thumbnail, edges stay crisp and colors remain consistent.
Editable text, shapes, and colors mean no workarounds. Change a headline font in seconds. Swap a gradient stop to match your brand palette. Reposition a circle to better align with supporting copy. There’s no rasterized masking or flattened layers hiding complexity—just intentional organization that respects your time.
When to consider this—and when to explore alternatives
This template shines when your message relies on sequence, cause-and-effect, or measurable progression. If you're explaining a five-stage sales funnel, outlining quarterly goals, or visualizing a sustainability initiative’s phased rollout, its architecture supports those needs directly.
It’s less suited for highly comparative data (e.g., side-by-side feature matrices) or dense statistical tables—formats where grid-based or horizontal layouts may offer more breathing room. Likewise, if your audience primarily engages via very narrow mobile feeds (like certain social platforms), test how the vertical rhythm translates at smaller widths. While scalable, extremely tall infographics may require thoughtful cropping or responsive fallbacks in some contexts.
That said, the inclusion of multiple export formats gives flexibility. Need a simplified version for internal Slack updates? Export the SVG and embed it directly. Preparing a printed annual report? Use the 300 DPI JPG or edit the AI file to add bleed and crop marks. The versatility lies not just in aesthetics—but in adaptability across mediums and audiences.
Design integrity meets everyday usability
Good infographic design balances intentionality with accessibility. This Vertical Rectangle Infographic avoids visual noise—no gratuitous shadows, textures, or competing typefaces. Instead, it leans on contrast, alignment, and restrained color variation to create emphasis. The gradient arrows aren’t random; they’re calibrated to guide attention without distracting from core messages.
Because everything is editable and vector-based, you’re not locked into someone else’s assumptions about hierarchy or tone. You decide whether a circle represents a person, a milestone, or a risk factor—and adjust size, stroke, or label accordingly. That level of control matters when consistency across collateral is non-negotiable, like maintaining brand voice across pitch decks, training materials, and website visuals.
For creators who value both aesthetic cohesion and functional efficiency, this template bridges the gap. It doesn’t replace strategic thinking—but it removes friction from execution. Less time wrestling with alignment or exporting issues means more time refining messaging, testing interpretations, or iterating based on feedback.
A resource built for iteration, not just installation
Infographics shouldn’t be one-off assets—they’re living components of ongoing communication. With fully editable layers and logical grouping, this Vertical Rectangle Infographic invites reuse. Update last year’s budget breakdown with this year’s figures. Repurpose the same flow to explain two different onboarding paths—one for customers, one for partners. Even shift color schemes seasonally while preserving structure and meaning.
And because it’s delivered with clear file types and no hidden dependencies, there’s no learning curve tied to proprietary tools or obscure plugins. Whether you’re using Illustrator daily or opening AI files only occasionally, the organization supports your workflow—not the other way around.
If you're evaluating resources for recurring visual communication needs—whether for client deliverables, internal knowledge sharing, or public-facing content—this Vertical Rectangle Infographic offers substance behind its style. It’s designed not to impress, but to clarify. Not to complicate, but to streamline. And not to sit unused in a downloads folder, but to become part of how you consistently make ideas visible, understandable, and actionable.