Cancer Research Infographic for Medical: A Clinical-Grade Visual Communication Tool
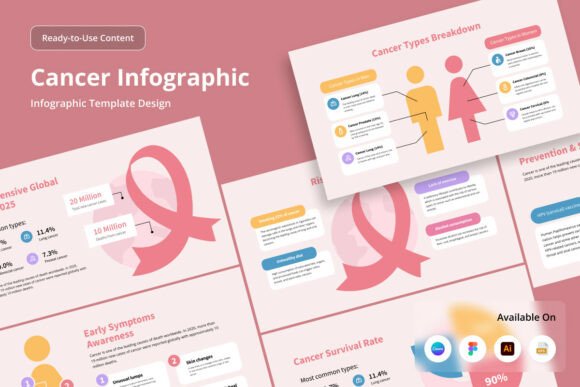
Effective communication of complex cancer data is no longer a luxury—it’s a clinical necessity. From tumor registry reports and clinical trial summaries to public health dashboards and patient education handouts, the ability to translate epidemiological findings, molecular insights, and survival metrics into clear, trustworthy visuals directly impacts decision-making, policy development, and health literacy. The Cancer Research Infographic for Medical meets this need with purpose-built design integrity: not as a generic template, but as a rigorously structured, clinically grounded visual framework engineered for accuracy, adaptability, and audience-specific clarity.
Why Clinical Context Demands More Than Aesthetic Appeal
In oncology, misinterpretation carries real-world consequences. A bar chart showing 5-year relative survival rates must distinguish between localized, regional, and distant disease stages—not just in labeling, but in spatial hierarchy and color logic. A heatmap illustrating geographic incidence variation requires precise alignment with standardized ICD-O-3 coding conventions and SEER-defined regions. This is where many off-the-shelf infographic assets fall short: they prioritize visual novelty over clinical fidelity. The Cancer Research Infographic for Medical reverses that priority. Its clean clinical aesthetic—characterized by restrained typography, intentional whitespace, calibrated grayscale gradients, and deliberate use of accent color only for evidence-based differentiation—supports cognitive processing rather than competing with it. There are no decorative flourishes, no ambiguous icons, and no arbitrary visual metaphors. Every line, label, and layout decision reflects an understanding of how clinicians, epidemiologists, and patients parse medical information.
Six Purpose-Built Layout Variations for Diverse Cancer Data Types
Rather than offering one-size-fits-all layouts, this resource provides six distinct infographic designs—each architected for a specific category of cancer-related insight:
- Epidemiology Snapshot: Optimized for presenting incidence, mortality, and prevalence trends across age, sex, race/ethnicity, and geography—using stacked area charts, choropleth-ready map placeholders, and standardized population denominators.
- Clinical Trial Summary: Structures key elements—patient enrollment criteria, intervention arms, primary endpoints, and adverse event frequencies—in a timeline-aligned, comparator-focused flow that mirrors IRB submission formats.
- Molecular Pathway Visualization: Supports annotation of driver mutations (e.g., BRAF V600E, EGFR L858R), therapeutic targets, and resistance mechanisms using scalable vector icons and labeled interaction arrows—designed to integrate seamlessly with genomic report outputs.
- Survival Analysis Display: Features editable Kaplan-Meier curve scaffolds with confidence interval shading, landmark timepoint markers (e.g., 12-month, 36-month), and hazard ratio callouts positioned for immediate interpretation.
- Healthcare Access & Disparities: Presents multilayered barriers—insurance status, transportation access, language concordance, and screening adherence—using proportional iconography and tiered color intensity to reflect magnitude without oversimplifying systemic complexity.
- Patient Journey Timeline: Maps diagnostic, treatment, and survivorship phases with editable milestones, decision points, and psychosocial support touchpoints—designed for shared decision-making tools and care navigation resources.
Each variation maintains consistent typographic hierarchy, spacing systems, and data-labeling conventions, enabling cross-report comparability—a critical requirement for institutional dashboards or multi-site research consortia.
True Editability Means Real Workflow Integration
“Editable” is often overstated in design assets. Many so-called customizable files lock users into rigid layer structures, require proprietary fonts, or collapse when text length changes. The Cancer Research Infographic for Medical delivers operational editability: every text box is unlinked from effects; every shape exists on its own named, non-grouped layer; every color swatch is defined in the global palette. This isn’t just convenient—it enables compliance with institutional branding guidelines (e.g., NIH blue, ACS coral, or hospital system palettes) and accessibility standards (WCAG 2.1 AA contrast ratios are pre-verified across all default color combinations). Because all fonts are free and open-source—including Roboto for body text and Source Sans Pro for headings—there’s zero licensing friction whether you’re a university lecturer preparing lecture slides or a startup founder building a HIPAA-compliant patient portal.
Multi-Platform File Ecosystem for Real-World Teams
Modern medical communication rarely lives in a single software environment. A researcher may draft figures in Illustrator, a communications officer may adapt them in Canva for social media, and an educator may import components into Figma for interactive e-learning modules. The Cancer Research Infographic for Medical anticipates this reality. It ships with native .AI files for precision vector editing, backward-compatible .EPS files for legacy publishing workflows, production-ready .FIG files with auto-layout constraints for collaborative design reviews, and a direct Canva link (.TXT) for rapid adaptation by non-designers. The included Readme file details font sourcing, layer naming logic, RGB color values (optimized for screen-based presentations at 72dpi), and best practices for exporting accessible PDFs—no guesswork, no version conflicts.
Who Benefits—and How They Use It
The utility of this resource extends far beyond graphic designers. Consider these real-world applications:
- Hospital Quality Improvement Teams use the Epidemiology Snapshot layout to visualize quarterly breast cancer screening adherence rates across primary care clinics—overlaying referral patterns and follow-up timeliness metrics to identify process bottlenecks.
- Academic Oncology Fellows adapt the Clinical Trial Summary variation to create presentation-ready slides for journal clubs, replacing placeholder text with actual NCT numbers, PFS hazard ratios, and RECIST response categories—without redesigning the entire visual architecture.
- Public Health Educators leverage the Patient Journey Timeline to co-create culturally responsive materials with community health workers, translating clinical terminology into plain-language milestones while preserving medical accuracy.
- Digital Health Startups integrate Molecular Pathway components into their clinician-facing apps, dynamically populating mutation labels and FDA-approved therapy icons based on user-uploaded NGS reports.
- Medical Illustration Students study the layer structure and annotation discipline as a masterclass in clinical visual rhetoric—learning how to balance scientific precision with narrative flow.
Design Integrity Meets Practical Constraints
Some might question why this resource specifies RGB color mode and 72dpi resolution. The answer lies in its primary use case: screen-based medical communication. Whether displayed on a 65-inch wall-mounted monitor in a tumor board room, embedded in a secure EHR dashboard, or viewed on a clinician’s tablet during rounds, the infographic must render crisply without bloated file sizes or unintended color shifts. CMYK conversion is unnecessary—and potentially harmful—for digital-first delivery. Likewise, the 72dpi specification ensures fast loading times and compatibility with web-based presentation platforms like PowerPoint Online or Google Slides, where higher DPI offers no perceptible benefit but increases bandwidth demands and rendering latency.
Customization Without Compromise
Customization here doesn’t mean “add clipart and change fonts.” It means adjusting the visual representation to match the rigor of your data. You can:
- Replace placeholder incidence bars with actual SEER*Stat-exported counts, maintaining proportional scaling and axis labeling consistency;
- Swap out generic “chemotherapy” icons for institution-specific drug logos or NCCN guideline-referenced symbols;
- Modify survival curve annotations to reflect your cohort’s median OS (not a stock value);
- Integrate institutional logos and disclaimers in designated footer zones without disrupting data hierarchy;
- Export individual components—like a standalone risk factor radar chart—as SVGs for embedding in dynamic web dashboards.
This level of fidelity transforms the Cancer Research Infographic for Medical from a static image into a living documentation standard—one that grows in value as your data evolves, your audience shifts, and your communication goals mature.
Building Trust Through Visual Transparency
In an era of widespread health misinformation, how data is presented matters as much as what is presented. A well-structured, consistently applied, and transparently editable infographic signals methodological rigor. When a researcher cites a figure generated from this resource, reviewers recognize the underlying structural discipline—the same way they trust a CONSORT diagram or STROBE flowchart. That trust isn’t earned through decoration; it’s earned through restraint, repeatability, and respect for the audience’s expertise—whether that audience is a biostatistician reviewing methodology or a newly diagnosed patient seeking clarity. The Cancer Research Infographic for Medical doesn’t simplify cancer science—it clarifies it, respectfully, precisely, and without compromise.