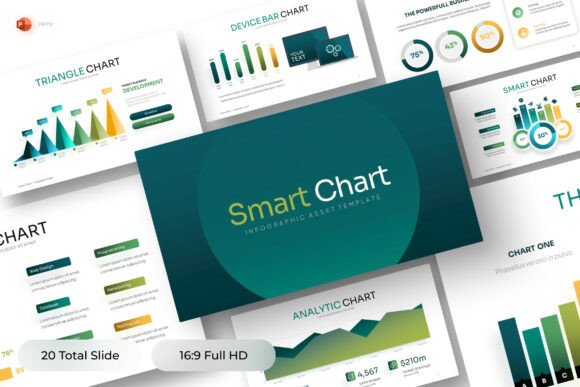
Smart Infographics PowerPoint Template
If you’ve ever spent hours wrestling with clunky charts, mismatched colors, or inconsistent layouts just to turn raw data into a clear, compelling presentation—you’re not alone. The Smart Infographics PowerPoint Template was built for exactly that moment: when clarity matters more than decoration, and speed shouldn’t mean sacrificing polish.
This isn’t just another slide deck with pretty icons. It’s a purpose-built toolkit—clean, modular, and deeply editable—designed for people who need to communicate insights fast: business analysts summarizing quarterly KPIs, consultants walking clients through market trends, marketing teams reporting campaign ROI, or educators visualizing survey results for stakeholders. Its teal-and-white palette isn’t arbitrary; it’s calibrated for readability, accessibility, and professional tone—no harsh contrasts, no visual fatigue.
Common Missteps—and Why They Slow You Down
Many users download the Smart Infographics PowerPoint Template expecting instant results—only to hit friction within minutes. Here’s where things often go sideways:
- Assuming “editable” means “plug-and-play.” Yes, every shape, chart, and icon is fully editable—but that doesn’t mean text auto-resizes or charts auto-update when you paste new numbers. For example, swapping a bar chart’s labels without adjusting axis spacing can clip text or misalign bars. That’s not a flaw in the template—it’s a design choice prioritizing control over automation. The fix? Spend 5 minutes reviewing the included Help Guide (it walks through chart reformatting, color overrides, and icon replacement) before diving into your first slide.
- Overlooking the 16:9 widescreen ratio during content planning. Some users build slides on older 4:3 templates, then copy-paste into this one—only to find titles cut off or diagrams crammed into corners. The Smart Infographics PowerPoint Template assumes modern displays and projector standards. If your team still uses legacy projectors, test one slide on their system first—or adjust margins manually (the guide shows how).
- Mistaking “free font included” for “font embedding guaranteed.” The package includes a clean, legible sans-serif font—but PowerPoint doesn’t embed fonts by default. If you email your deck to a colleague who lacks that font, text may reflow or revert to Calibri. The safer move? Embed fonts before sharing (File > Options > Save > check “Embed fonts in the file”) or use the built-in fallback: the template’s layout works cleanly with common system fonts like Segoe UI or Helvetica Neue if needed.
- Expecting stock images—and being surprised they’re not there. All visuals (charts, icons, diagrams) are native PowerPoint objects—not embedded PNGs or JPEGs. That’s intentional: it keeps files lightweight and edits precise. But some users assume “infographic” means photo-rich slides. Remember: this template excels at data storytelling, not photo essays. Need imagery? Insert your own high-res assets—PowerPoint handles them smoothly alongside the editable vector elements.
What to Check Before You Commit
Before downloading or purchasing, ask yourself three practical questions:
- Do I actually need 87+ infographic variations—or will 10–15 core layouts cover 90% of my use cases? The Smart Infographics PowerPoint Template includes progress trackers, funnel diagrams, comparison matrices, timeline flows, and radial KPI dashboards—but if your work leans heavily on financial modeling or technical architecture, you may need supplemental tools. Scan the slide thumbnails first. If most layouts feel relevant to your reporting rhythm (e.g., monthly sales reviews, UX research summaries, budget forecasts), it’s a strong fit.
- Is my team comfortable editing native PowerPoint objects—or do we rely on pre-built animations and transitions? This template delivers maximum flexibility because everything is built with shapes, grouped vectors, and Excel-linked charts—not static graphics. That means no lost fidelity when resizing, recoloring, or rearranging. But it also means basic PowerPoint familiarity helps. If your team is newer to the platform, allocate 20 minutes for a shared walkthrough using the Help Guide—it pays off fast in reduced revision rounds.
- Will this integrate with how we share and collaborate? Since all elements are native PowerPoint, co-editing in Microsoft 365 works seamlessly. No broken links, no missing fonts (if embedded), no compatibility hiccups across Windows/macOS. But if your workflow depends on Google Slides export, know this: complex grouped infographics may simplify on conversion. Test one critical slide first—especially if you present live via Google Meet or need real-time commenting outside the Microsoft ecosystem.
Better Choices, Built In
The strength of the Smart Infographics PowerPoint Template lies in what it avoids as much as what it includes. It doesn’t bloat files with unused master slides. It doesn’t lock you into rigid color schemes—you can recolor any element in one click. It doesn’t force animation-heavy builds that distract from data. Instead, it gives you room to think, adapt, and focus on the story behind the numbers.
For a marketing manager presenting Q3 social engagement metrics, that means swapping out a generic pie chart for a custom donut + annotation combo in under two minutes—then adjusting the teal accent to match brand guidelines. For a freelance consultant, it means reusing the same funnel diagram across five client decks, each with different stage labels and conversion percentages—no redesigning from scratch.
And because it’s built on standard PowerPoint architecture—not proprietary add-ins or macros—it stays compatible across versions (2016 through Microsoft 365) and requires no extra software, subscriptions, or learning curves. What you gain is time: less formatting, fewer “why won’t this align?” moments, and more space to refine your message.
If your goal is to turn analysis into impact—not just deliver data, but make it understood—the Smart Infographics PowerPoint Template earns its place not as a shortcut, but as a thoughtful foundation. It respects your expertise, supports your deadlines, and quietly handles the visual heavy lifting—so your insights take center stage.