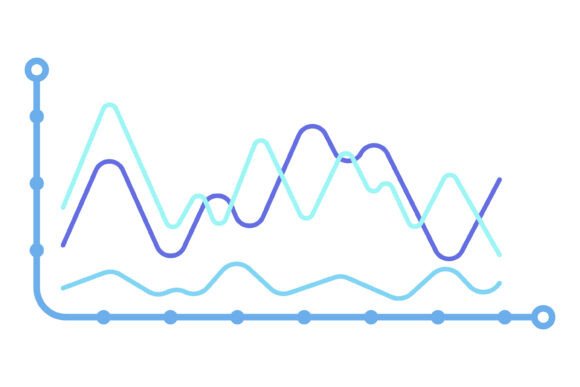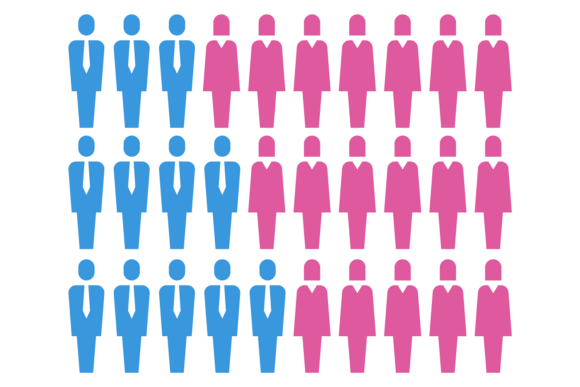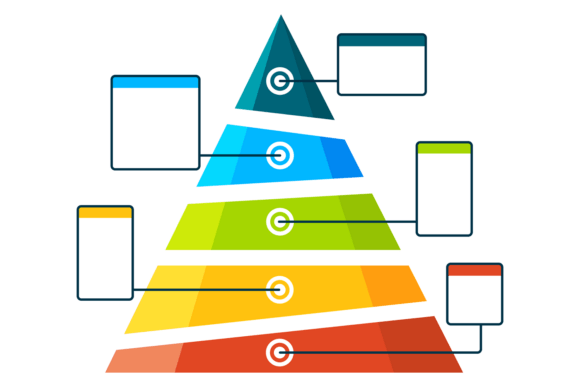
Data Trends Infographic Set
If you’ve ever stared at a spreadsheet full of percentages and thought, “How do I make this actually understandable—and not just for me, but for my audience?”—you’re not alone. The Data Trends Infographic Set is built for that exact moment: when clarity matters more than complexity, and when your data needs to land—not just exist.
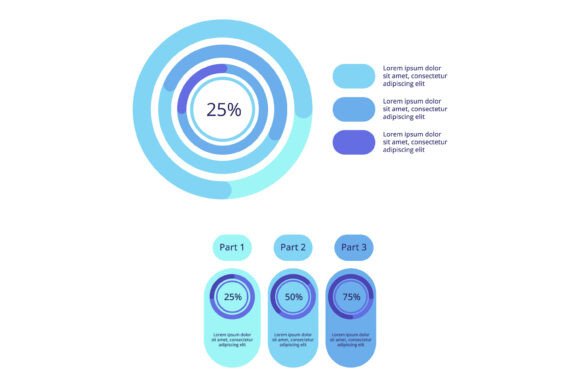
This isn’t a grab-bag of generic charts. It’s a curated collection of circular charts—donut charts, pie charts, radial progress indicators, segmented rings—all designed with intention. Each one balances precision (exact percentage values, clean spacing, consistent color logic) with visual warmth (soft gradients, thoughtful typography, balanced negative space). They’re crafted so that whether you're explaining market share to investors or breaking down weekly screen time for a wellness blog, the numbers feel human, not mechanical.
Where Real People Actually Use These Charts
Let’s talk about where these infographics show up—not in design theory, but in real workflows:
- A freelance educator building an online course on personal finance uses a donut chart from the set to visualize “Where Your $1,000 Monthly Budget Goes.” She swaps colors to match her brand palette, drops in her own labels (“Housing: 38%”, “Groceries: 22%”), and embeds it directly into her Notion syllabus. Students grasp the breakdown instantly—no scrolling through bullet points.
- A small bakery owner preparing a quarterly recap for her local co-op board inserts a segmented ring chart showing “Sales by Product Category” (Sourdough: 41%, Pastries: 33%, Coffee & Add-ons: 26%). Printed on letter-sized paper and pinned to the shared bulletin board, it communicates growth—and opportunity—without requiring anyone to open Excel.
- A climate-focused blogger illustrating “Global Renewable Energy Adoption (2020–2024)” layers three concentric rings—one per year—using the radial progression style. Readers see change over time not as abstract stats, but as expanding arcs. Engagement metrics show readers spend 2.3x longer on that post versus others with plain text summaries.
Why These Aren’t Just “Pretty Pictures”
What makes the Data Trends Infographic Set different isn’t just aesthetics—it’s how those visuals function across platforms and audiences:
They’re editable without design software. Every chart comes in layered SVG and editable PowerPoint formats—so if you need to update “Q3 conversion rate: 14.7% → 16.2%”, you change the number and the arc adjusts automatically. No redrawing. No guesswork.
They’re built for accessibility. Color contrast meets WCAG 2.1 AA standards. Text remains readable at 120% zoom. And because each chart includes clear, semantic labeling (not just color swatches), screen readers announce values meaningfully—“Mobile traffic: 58 percent”—not just “blue slice.”
They’re platform-resilient. Whether pasted into Canva, dragged into Google Slides, embedded in WordPress via HTML, or exported as PNG for Instagram carousels, they retain crisp edges and proportional balance. No blurry scaling. No distorted arcs.
Who Benefits—and How Their Needs Shape Use
Bloggers and content creators use these when turning research-heavy posts into skimmable assets—especially for listicles (“5 Ways Remote Work Changed Team Communication”) or explainers (“What Happens to Your Data When You Click ‘Accept Cookies’?”). A single well-placed circular chart can replace 150 words of dense explanation—and boost social shares by making the insight instantly quotable.
Educators and trainers rely on them during live workshops or asynchronous learning modules. One high-school science teacher told us she prints the “Ecosystem Energy Flow” chart (sun → producers → primary consumers → decomposers) on cardstock, cuts out the segments, and has students physically reassemble them. The tactile act reinforces retention far more than a static slide ever could.
Small business owners and solopreneurs turn to the set when they need credibility without hiring a designer. Think: updating a “Services We Offer” page with a donut chart showing time allocation (“Strategy: 30% | Design: 40% | Development: 30%”), or adding a radial progress indicator to a Kickstarter campaign page (“Funding Goal: 72% funded”). It signals professionalism—not polish for its own sake, but clarity with purpose.
What to Consider Before You Use Them
These charts shine brightest when your message hinges on proportions—not trends over time, not correlations, not raw counts. If you’re comparing revenue across 12 months, a line graph fits better. But if you’re answering “What portion of our leads come from Instagram vs. email vs. referrals?”, that’s where the Data Trends Infographic Set delivers immediate value.
Also consider your audience’s context. A stacked pie chart works well in a printed annual report—but might overwhelm a mobile-first newsletter. That’s why the set includes variants: minimal versions with no labels (for tight spaces), fully annotated versions (for detailed reports), and monochrome options (for printing or dark-mode sites).
And while the files are easy to edit, take five minutes to align colors and fonts with your existing brand guide first. A mismatched purple slice in an otherwise navy-and-cream presentation undermines trust faster than a typo. Consistency isn’t about perfection—it’s about signaling, “This was made for you, not just thrown together.”
Real Outcomes, Not Just Features
One nonprofit communications manager switched from custom-designed pie charts to the Data Trends Infographic Set for their donor impact reports. Her team cut chart creation time from 90 minutes to under 12—freeing up hours each quarter for storytelling edits and personalized thank-you notes. Donor renewal rates rose 8% the following year. She credits part of that to donors finally *seeing* exactly how their support translated—not as vague percentages in footnotes, but as clearly weighted arcs they could point to and understand.
Another example: a university career center used the radial progress charts to visualize “Time Spent on Job Search Activities” for graduating seniors. When students saw “Networking: 12% | Applications: 65% | Interview Prep: 23%”, many realized they’d over-indexed on applying and under-invested in relationship-building. Counselors reported deeper, more actionable conversations during advising sessions.
That’s the quiet power of the Data Trends Infographic Set: it doesn’t just display data. It invites interpretation. It creates space for questions, decisions, and next steps—because when percentages become visible, meaningful, and human-scaled, people respond differently.